Ask a test engineer what is running on channel 12 of the Arbin in bay B, and they can usually tell you. Ask what is running across the whole lab (Arbin, Maccor, Neware, BioLogic) at 4:30 on a Thursday, and the answer often starts with a pause, then a spreadsheet, then three vendor UIs.
That gap is the lab ops problem. Not "do we have data." Not "can we plot capacity fade." The question is simpler and more urgent: what is running right now, and what is free next?
The status stack most labs actually run
A typical multi-brand R&D lab ends up with four layers of "truth," none of which agree for long:
- OEM software. Arbin MITS, BioLogic BT-Lab (Global View), Maccor clients, Neware BTS. Excellent for controlling that brand's channels. Useless as a lab-wide answer unless you only buy one vendor.
- Shared spreadsheets. Channel assignments, estimated end times, who requested the test. Editable by everyone, trusted by no one after the second concurrent edit.
- Chat. "Is Ch 07 free?" lives in Slack or Teams. The answer is stale by the time the message is marked unread.
- Data platforms. Measure-style systems and analytics tools answer "what did we measure?" They are not designed to answer "what is on the rack this afternoon?"
OEM Global Views solve the first layer for a single fleet. Enterprise lab management platforms (AVL Lab Management, Keysight PathWave) solve a larger problem: work orders, chambers, roles, and utilization at OEM/Tier-1 scale. Mid-size R&D teams sitting between those poles are left stitching status by hand.
Why "up to date" is harder than it sounds
Channel status sounds like a boolean. In practice it is a small state machine:
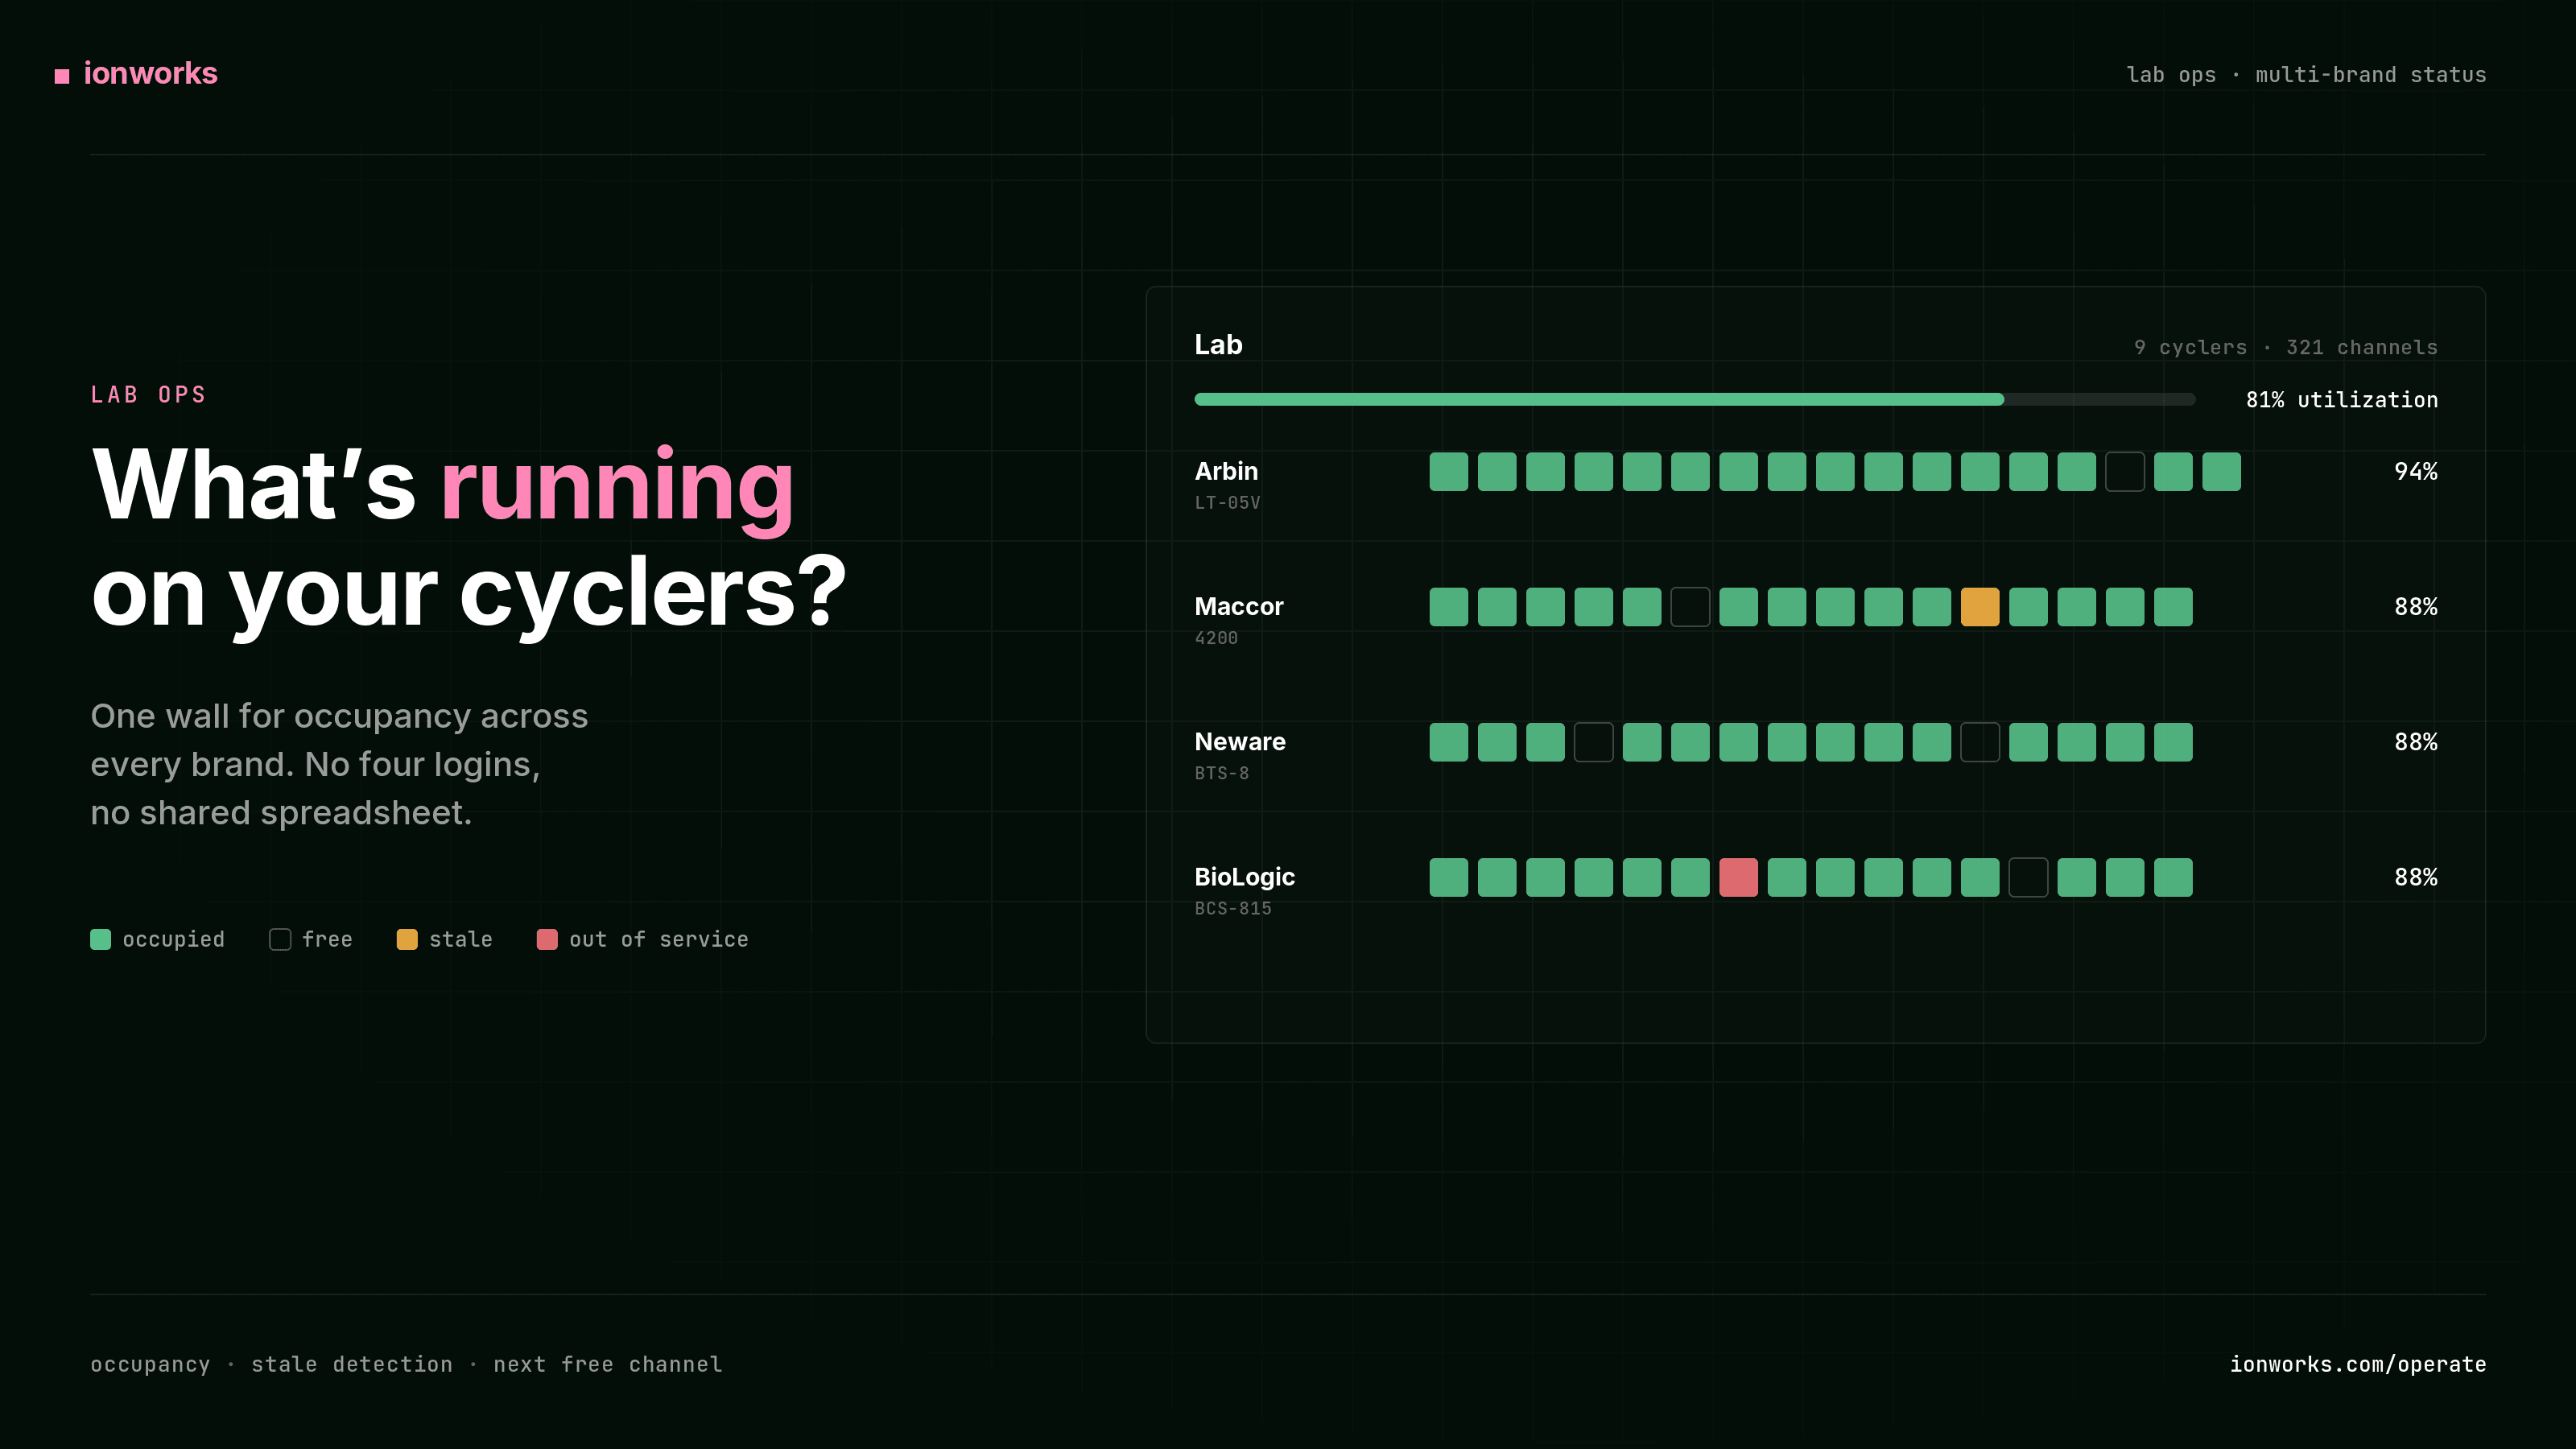
- Occupied. A measurement is linked to the channel and still running.
- Free. Nothing is booked or running; the channel can take the next test request.
- Stale. Something looks occupied, but data has stopped updating. The test may have finished, faulted, or the upload path broke.
- Out of service. Hardware or calibration holds the channel out of the queue.
Without stale detection, a spreadsheet full of green "running" rows quietly overstates utilization. Without a shared wall, scheduling teams book into occupied channels and test engineers spend the morning untangling the queue.
Channel occupancy in the manufacturing sense (how long a cell holds a formation channel) is a throughput economics problem. In R&D labs the related pain is operational: get up-to-date info on all your tests without opening every cycler UI.
Multi-brand is the default, not the edge case
North American and European R&D labs rarely standardize on one cycler brand. Arbin for high-volume aging, Maccor for precision work, BioLogic on the bench, Neware for overflow capacity. Each brand ships a capable monitor. None of them will show you the others.
Data teams already felt this on the file side. That is why cycler format guides and open parsers exist. The same fragmentation applies to live status. If your status answer requires four logins, you do not have a lab view. You have four instrument views.
What a lab wall has to do
A useful wall is not a prettier spreadsheet. It has to:
- Show fleet-level utilization and per-cycler breakdowns.
- Expand into a channel grid with enough metadata to act (cell, estimated end, ratings).
- Drill into what is running now on a channel (live voltage/current, mark complete).
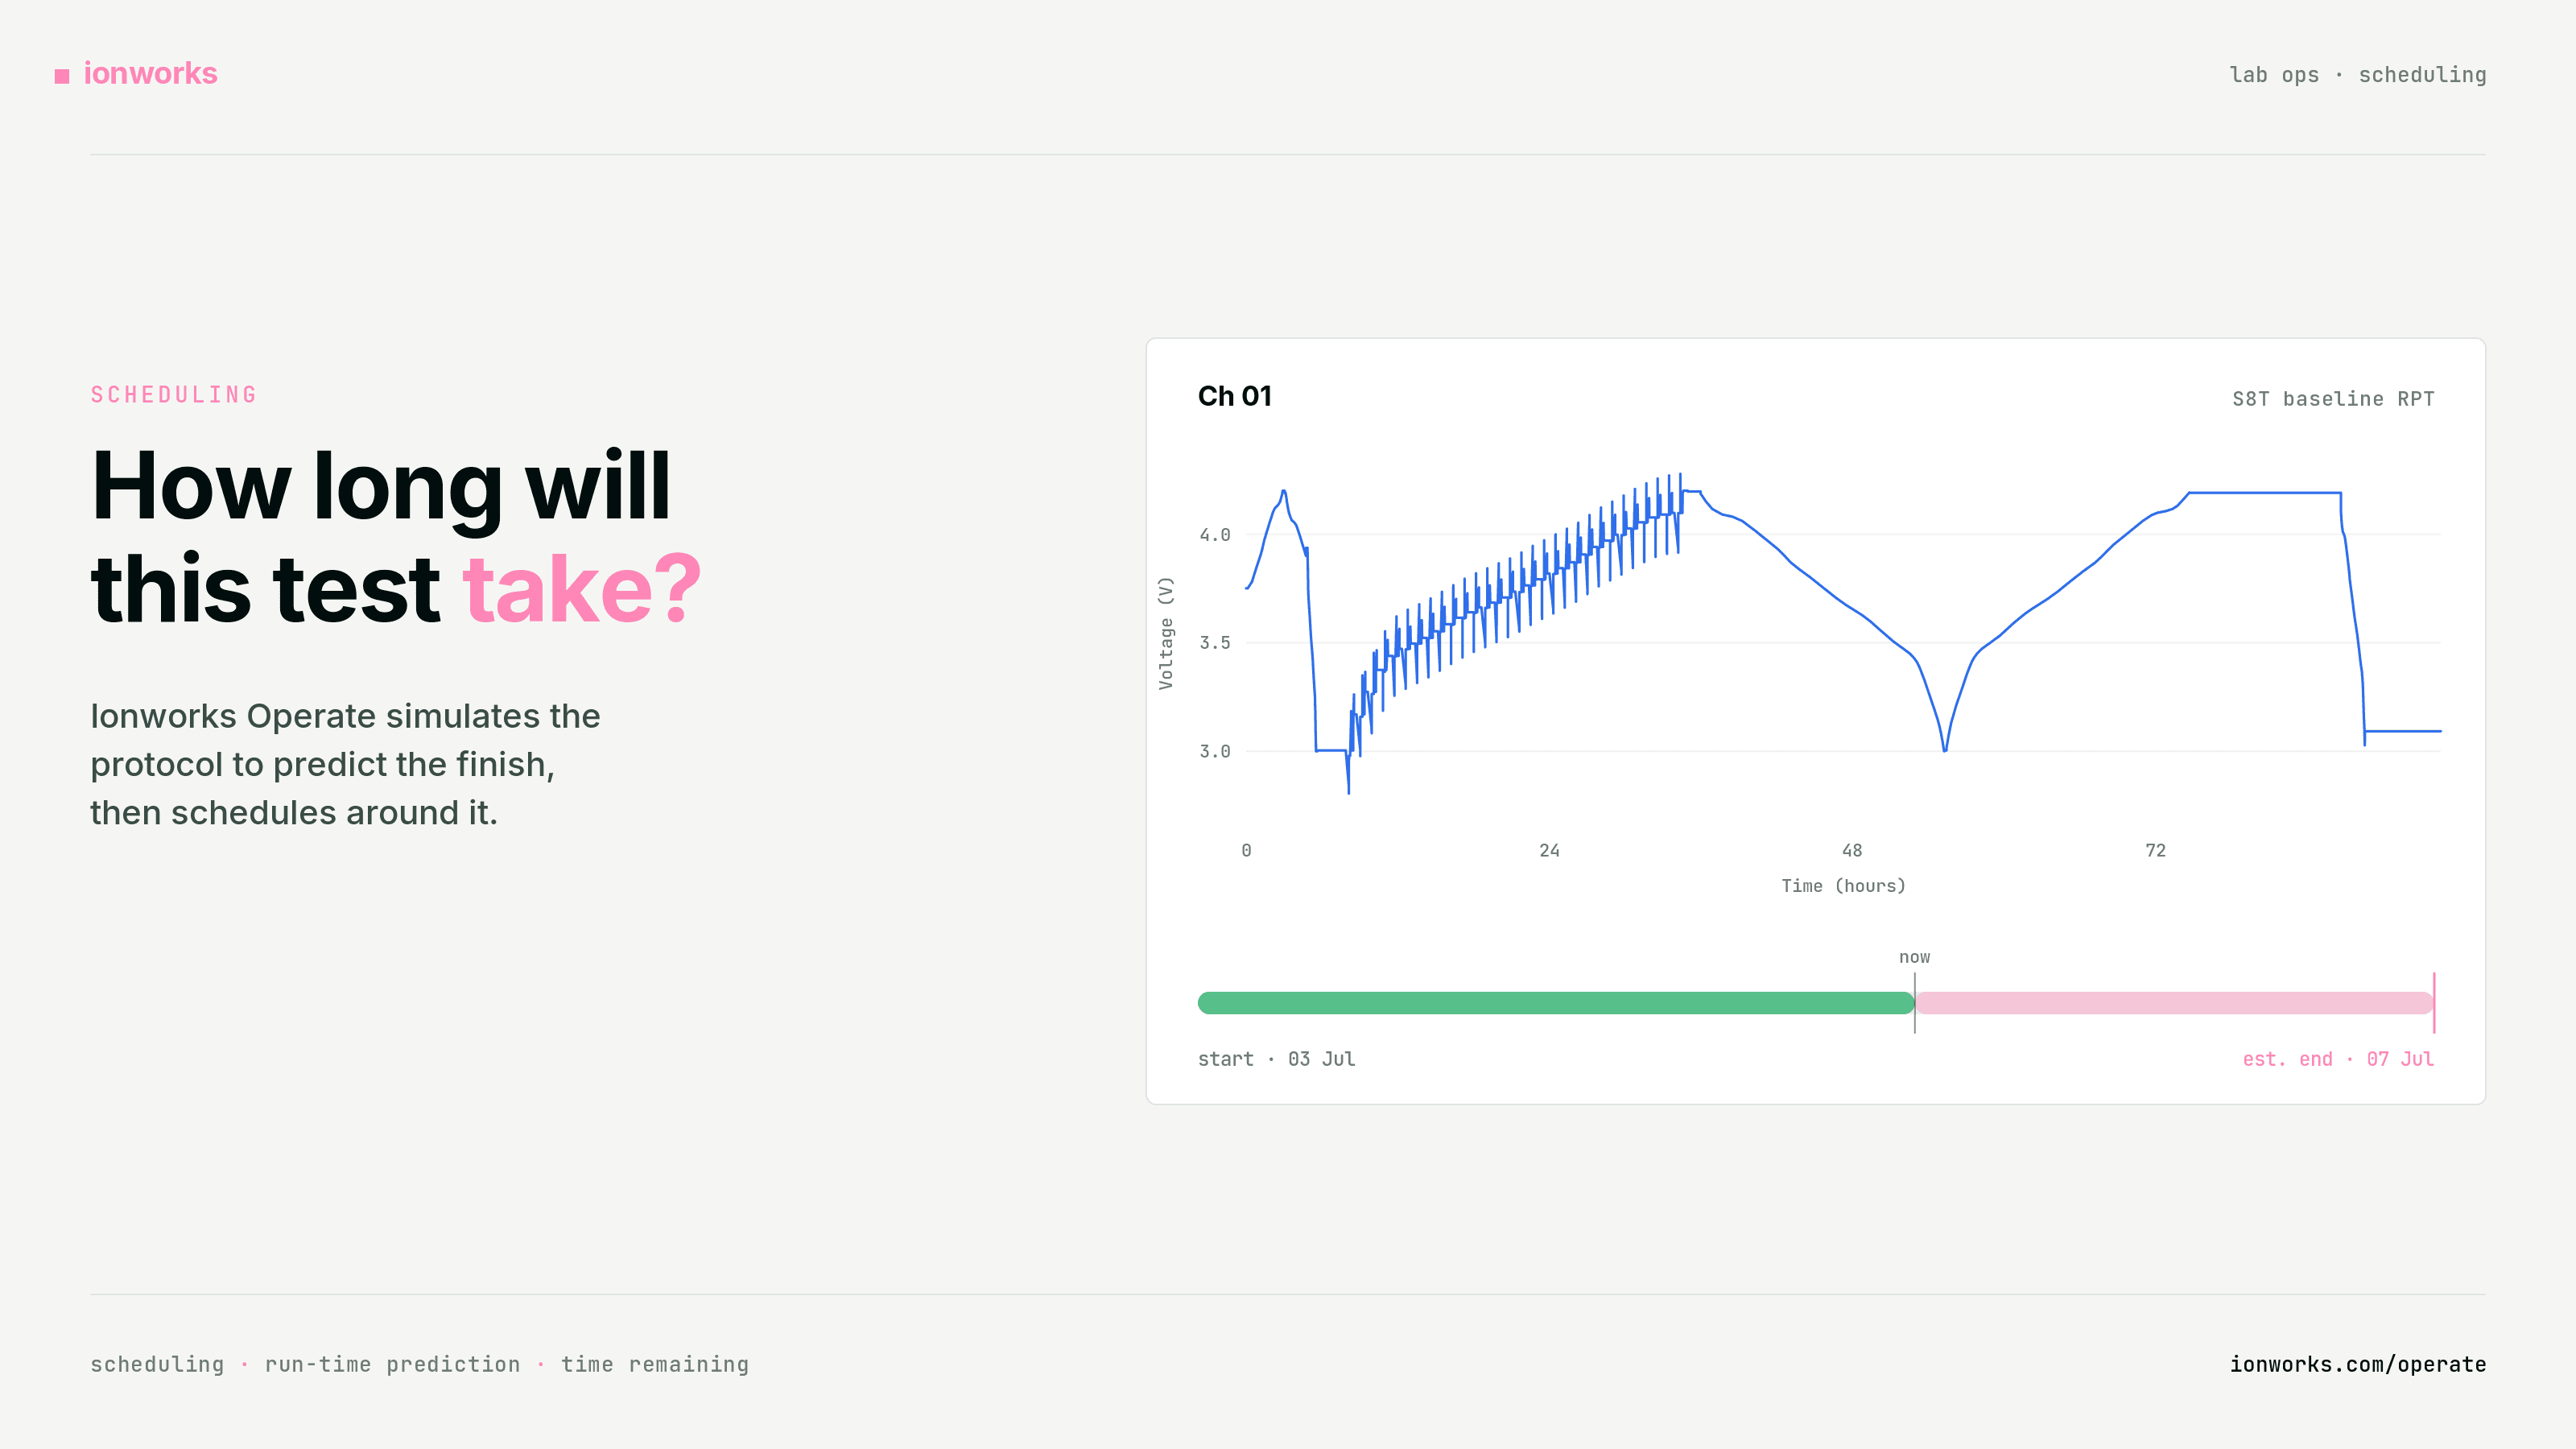
- Accept a test request, predict how long it will run by simulating the protocol, and book it onto a free channel with a realistic next-available start time.
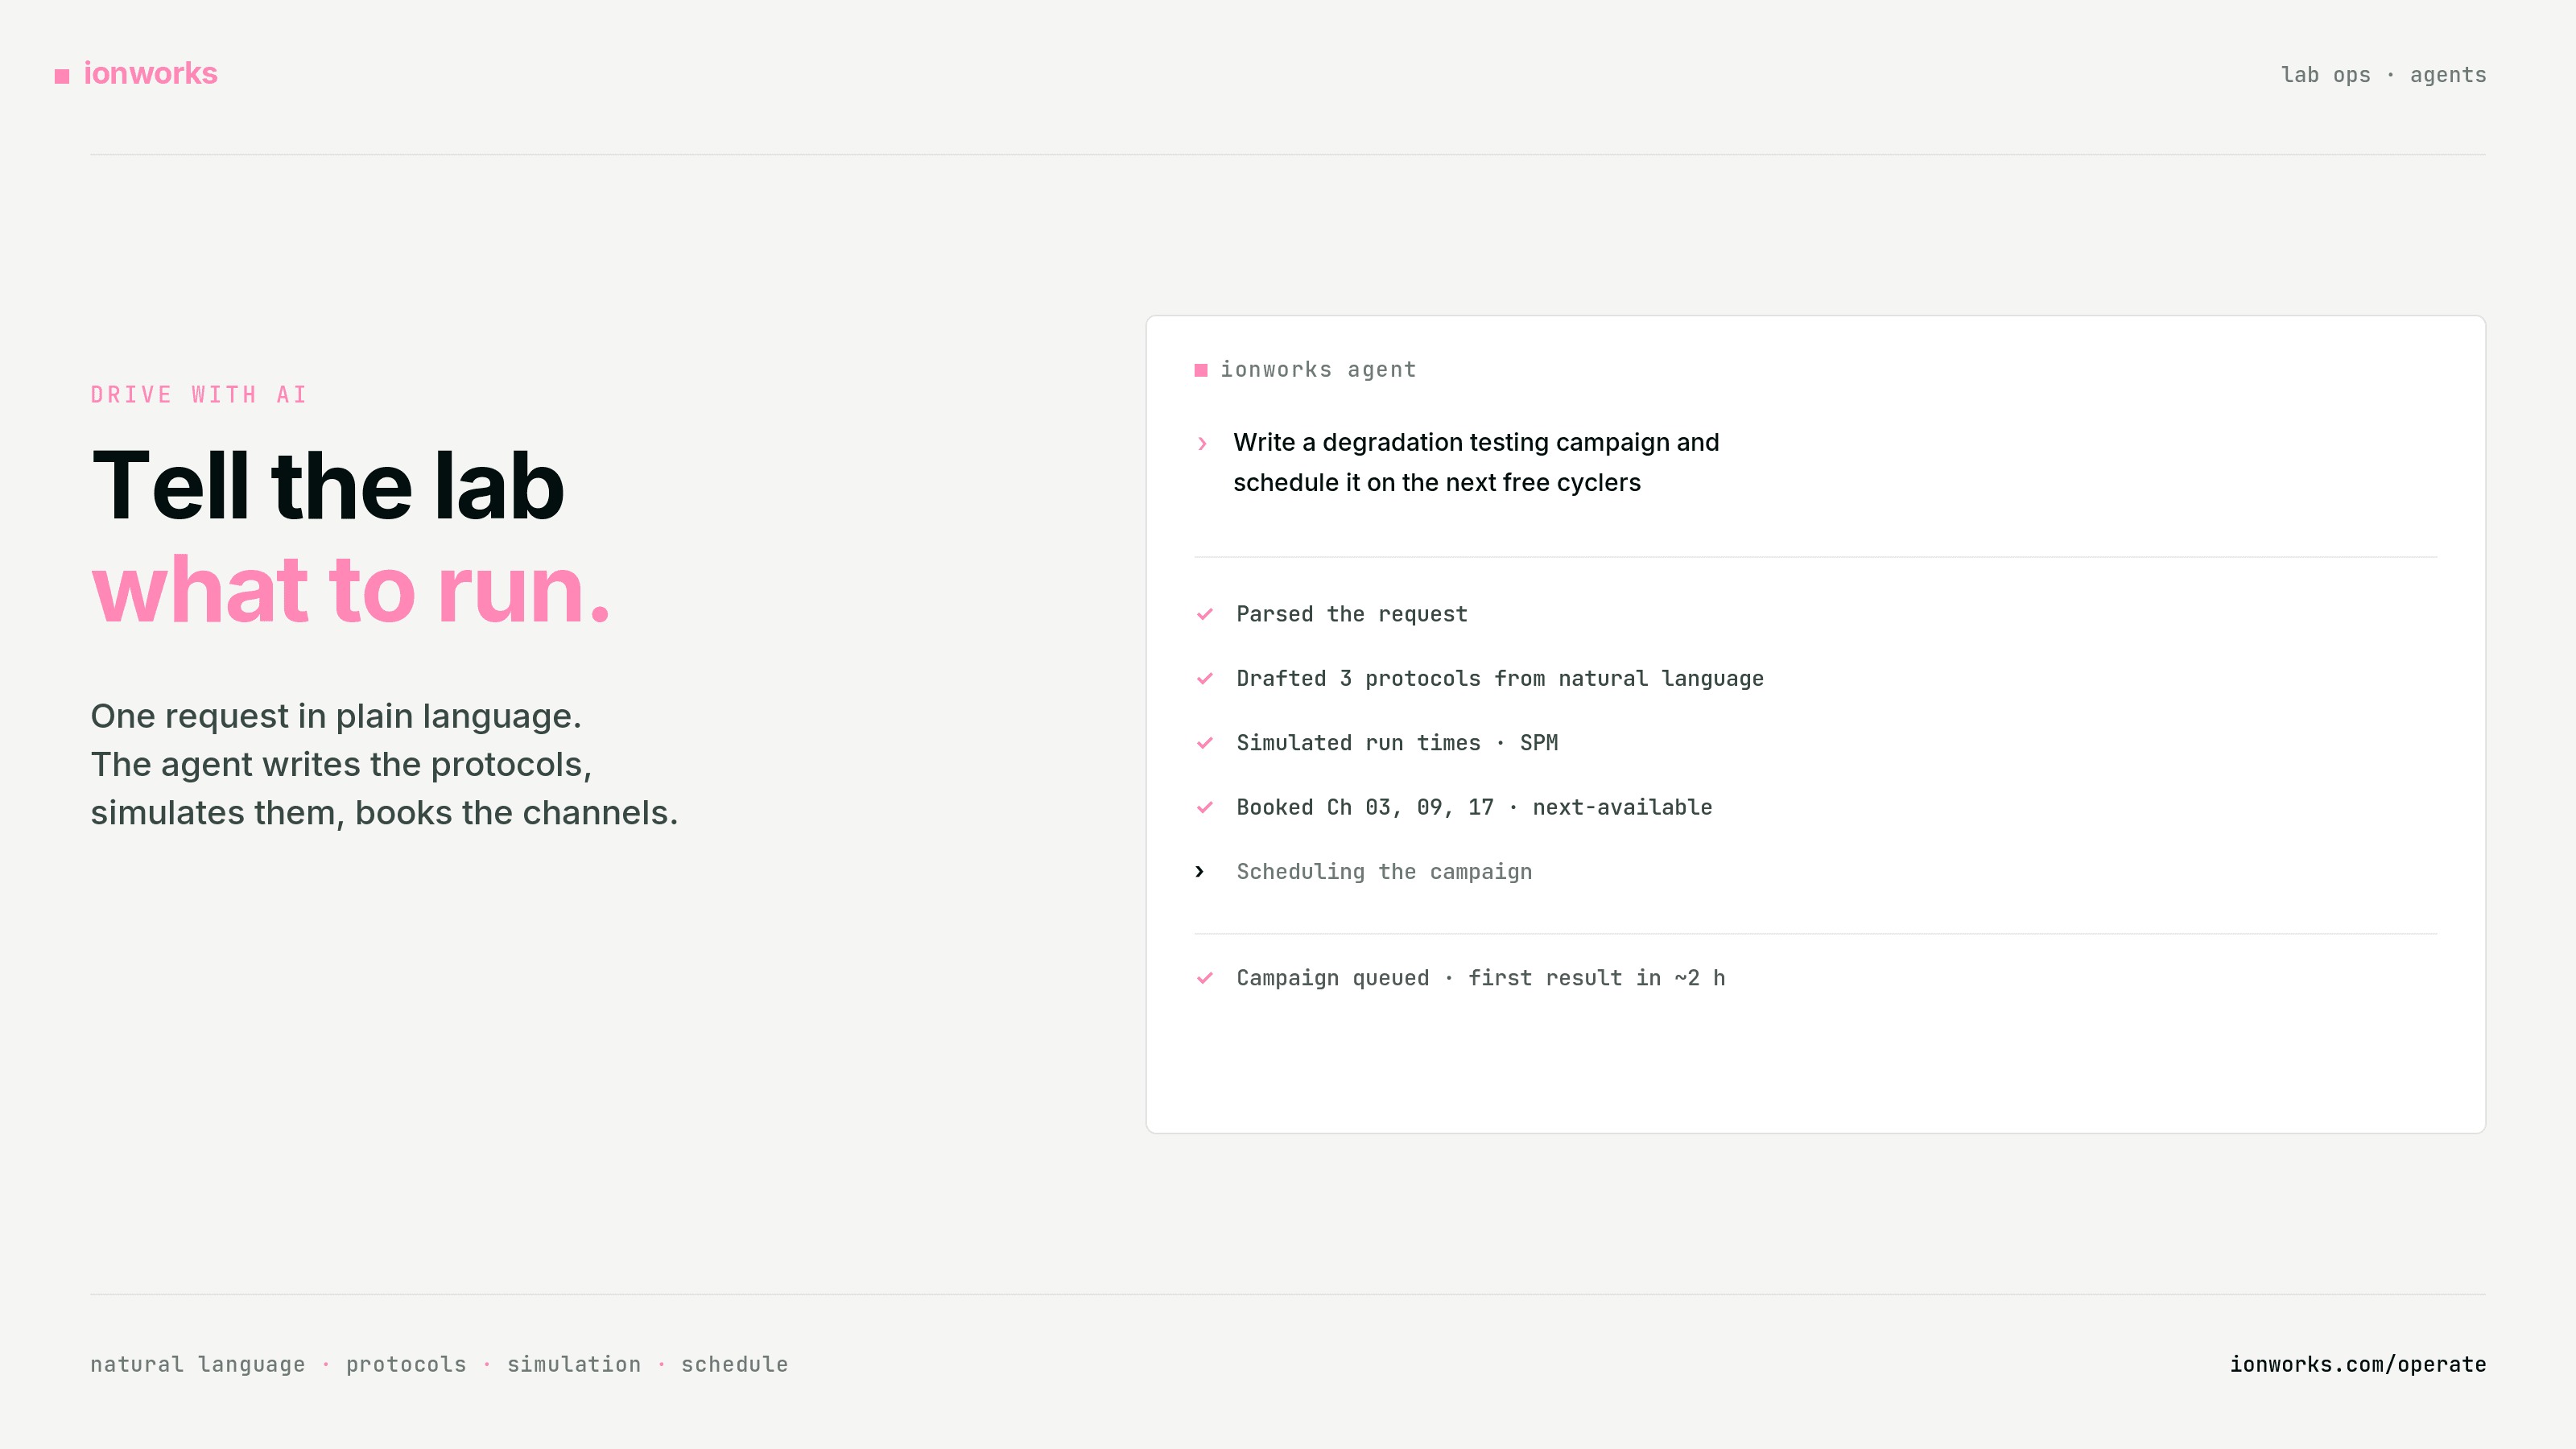
- Answer ops questions in plain language through an agent that reads the same occupancy and queue ("what is free on the Maccor, and for how long?").
- Stay consistent with the same measurements your data and modeling workflows already use.
That last point matters. A status tool that invents a second inventory of cells and tests becomes another spreadsheet. Status has to ride on the same structured objects as lab data management. For how Ionworks Operate sits next to AVL, Keysight, Neware LIMS, Ohmic, and Labverse, see the battery lab management software comparison.
Where Ionworks Operate fits
Ionworks Operate is Ionworks' answer for test engineers and scheduling teams: one wall for occupancy across the project, a test scheduler that predicts run time by simulating the protocol, and an agent that answers the same questions in plain language ("what is on LT Cycler 01 / Ch 02, and when does it free up?").
Two things set it apart from a status board. Because it runs on Ionworks' physics models, it can estimate how long a running test has left and how long a new one will take, so the schedule reflects real finish times instead of guesses. And the agent works on that same data, so booking a channel or checking the queue is a sentence, not a hunt through vendor UIs. Both hold whether the lab has twenty channels or a thousand.
It is not a full battery LIMS (samples, CNAS reports, method libraries). It is not Arbin MITS or BioLogic Global View (those remain the right tools to control those instruments). It is the multi-brand ops layer on top of Ionworks measurements: up-to-date status, then a booked channel, without a shared sheet.
Getting a clear answer
If your team still answers "what's running?" with three windows and a spreadsheet, the fix is not another column in the sheet. It is a single wall that updates from the same data path as the rest of the lab.
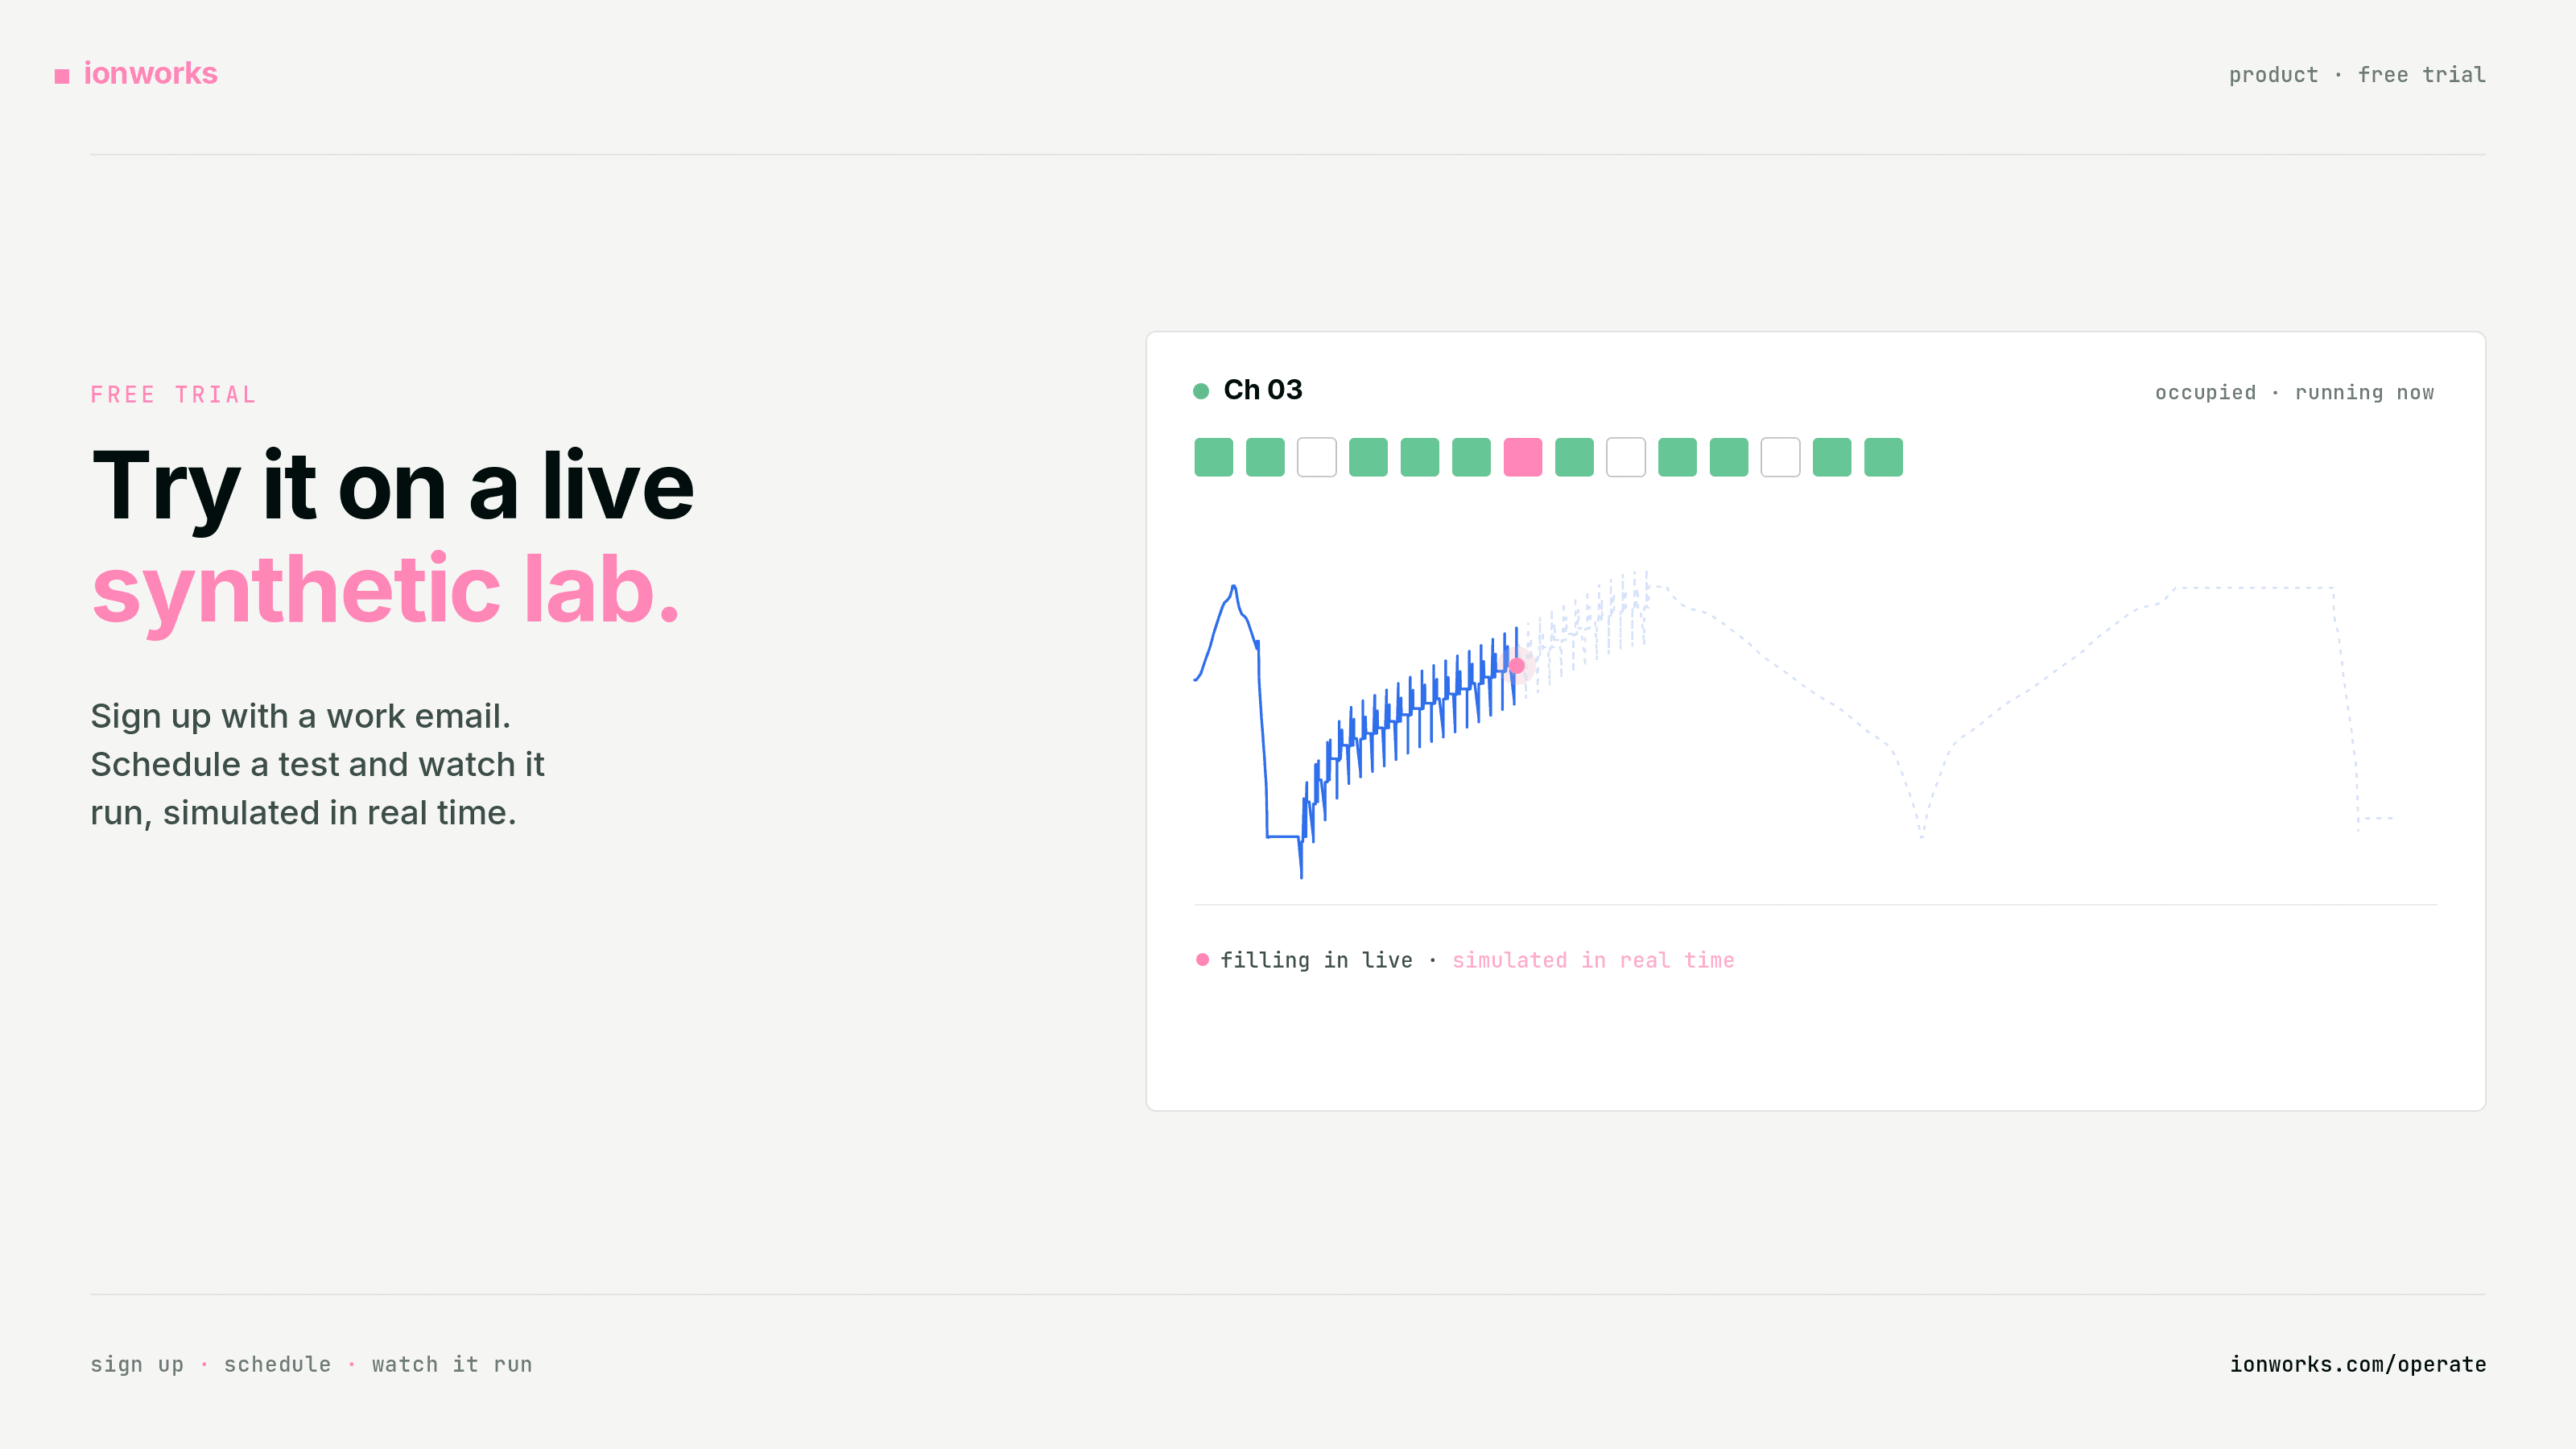
Request a seeded Ionworks Operate demo (work email) to walk a project with occupancy data already loaded, or start from Measure if your bottleneck is still getting Maccor and Neware files into one structured system.
Frequently asked questions
Continue reading