Hook a displacement sensor to a pouch cell, charge it slowly, and plot thickness against state of charge (SoC). You expect a clean ramp: more lithium in the anode, thicker cell. What you often get instead is a curve that rises, flattens, dips, and rises again. The cell swells for part of the charge and shrinks for another part, all while current flows in the same direction.
This is not noise, and it is not a measurement artifact. It is the signature of two electrodes that each expand and contract monotonically, fighting each other inside the same stack. The non-monotonic cell behavior falls out of the geometry once you write down what each electrode is actually doing.
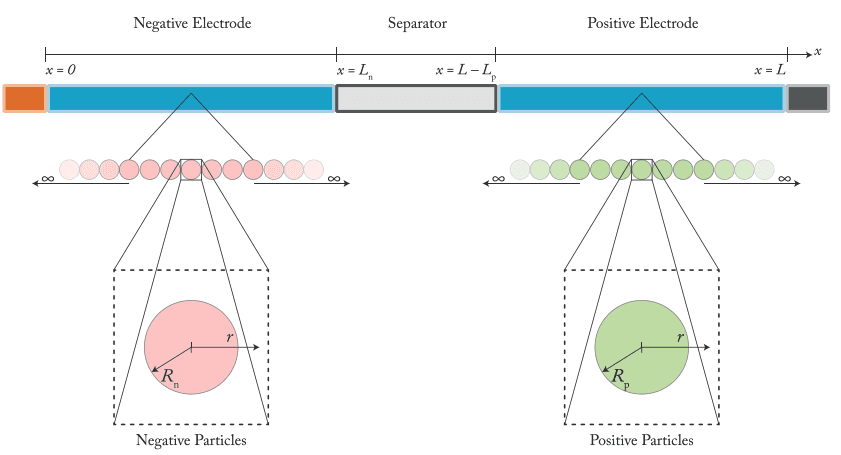
A cell is a sum of two opposing electrodes
Cell thickness is the sum of the layer thicknesses. Mohtat, Lee, Siegel, and Stefanopoulou (2019) write it as
t_cell(z) = n_c · [ t_n(x) + t_p(y) ] + t_inactive
where x is the anode lithiation, y is the cathode lithiation, n_c is the number of stacked layers, and t_inactive covers separators, current collectors, and the rest. The inactive term does not move with SoC. The two electrode terms do, and they move in opposite directions.
During charge, lithium leaves the cathode and enters the anode. For a graphite/LFP cell, graphite lithiates from x_0 toward x_100 and expands. LFP delithiates from near y = 1 toward y = 0 and contracts as LiFePO4 converts to the smaller FePO4 unit cell. Each electrode is monotonic in its own lithiation: graphite volume rises with x, LFP volume rises with y. Neither one ever reverses.
The cell sees the sum. And the sum of a rising term and a falling term does not have to be monotonic.
The slopes are piecewise, not constant
If both electrodes expanded at a constant rate, the sum would still be a straight line, just with a smaller slope. Non-monotonic behavior needs something more: the rate of expansion has to change along the way, and at some point the contracting electrode has to win.
Graphite supplies exactly this. As lithium intercalates, graphite passes through a sequence of staging phases, and the volume change is piecewise linear with a different slope in each stage. Using the lattice data in Mohtat et al., the through-thickness volume change of graphite is
Δv_n(x) [%] =  16.96·x                    x < 0.13     (dilute → stage 4)
               16.91·(x − 0.13) + 2.20    0.13 ≤ x ≤ 0.24   (stage 4 → 3)
                8.13·(x − 0.24) + 4.06    0.24 ≤ x ≤ 0.50   (stage 3 → 2)
               13.76·(x − 0.50) + 6.18    0.50 ≤ x          (stage 2 → 1)
(The constant on the last segment is set to 6.18% so the function stays continuous and lands at 13.06% at full lithiation, matching the lattice data in the paper's Table 2.)
Read the slopes: roughly 17%/unit-x at low lithiation, dropping to about 8 in the stage 3 to stage 2 region, then climbing back to about 14 as the cell fills toward LiC6. Graphite expansion never goes negative. But its rate nearly halves through the middle of the charge before recovering.
LFP, by contrast, has a single two-phase plateau and a near-constant slope:
Δv_p(y) [%] = −6.76·(1 − y)
About 6.8% of contraction spread evenly across the delithiation, with no staging features.
Where the cathode wins
Now the non-monotonicity is visible. Convert each volume change to a thickness contribution (Mohtat et al. use Δt_i = ξ_i · t_i^0 · Δv_i, scaling by the active volume fraction and the electrode's base thickness) and add them. The cell expands wherever the graphite slope beats the LFP contraction rate, and it contracts wherever the graphite slope falls below it.
In the dilute and stage 2-to-1 regions, graphite is expanding fast enough to overwhelm the steady LFP contraction, so the cell grows. In the shallow stage 3-to-2 window, graphite's expansion rate drops far enough that the cathode contraction takes over, and the stack thins even though the cell is still charging. The result is the hump-and-dip thickness curve seen in the LFP cell data, where overall expansion is clearly non-monotonic against SoC.
The same accounting explains why LFP cells barely breathe overall. Graphite swells about 13% to LiC6 while LFP contracts about 6.8%, and the two contributions cancel for much of the window. The cancellation is not perfect at every SoC, which is precisely why the residual is non-monotonic rather than flat.
It is chemistry-dependent, and that is the useful part
Whether a cell breathes monotonically comes down to the partial molar volume of the positive electrode and how its slope compares to the anode's staging slopes. NMC and NCA contract on charge as well, by a few percent, but with different slope structure than LFP, so the crossover points land at different SoC. Silicon-bearing anodes change the picture again: silicon's volume swing is large enough that its contribution dominates and the staging features of graphite get buried. Multi-scale studies that track particle, electrode, and pouch-cell thickness together, such as Pegel and co-workers on NMC811/SiOx cells, show how the electrode-level curves propagate up to the measured cell breathing.
This is why expansion is worth modeling rather than treating as a nuisance. The thickness signal carries the same staging and phase-transition information as the open-circuit voltage curve, and the slope changes line up with electrode-specific events. Mohtat et al. use exactly this: adding expansion to a voltage measurement lets them estimate electrode-specific state of health without discharging the cell past 70% depth of discharge (DoD), because the slope changes at phase transitions sharpen the parameter identifiability. A signal that looks like a measurement headache turns out to be a second, independent window into what each electrode is doing.
If you are building a cell model and the measured thickness refuses to track SoC cleanly, the model is not broken. The cell is doing what two opposing, piecewise-expanding electrodes always do. The work is in getting both electrode expansion functions right, so the sum lands where the sensor says it should.
Frequently asked questions
Continue reading