Your phone reads 40%. You assume you have 40% of your time left before it dies. You almost certainly have less, and if you are pushing the phone hard, meaningfully less. The number on the screen is state of charge, and state of charge counts electrons, not minutes. What you actually care about is energy, and the two do not track each other once a battery is under load.
Short answer: for anything that draws roughly constant power, state of charge overstates how much runtime is left, and the error grows with power. Two separate effects are responsible. The first comes from the shape of the open-circuit voltage curve and is present even at vanishingly small current. The second comes from the relationship between power, voltage, and current under load, and grows with discharge rate. The rest of this post uses PyBaMM simulations run by Ionworks to separate the two, quantify them on a real NMC cell, and show why the metric on your dashboard matters for power-driven applications.
Charge and energy are not the same currency
State of charge (SoC) is the ratio of charge remaining to charge capacity, measured in amp-hours. It is what a coulomb counter tracks: integrate the current, divide by capacity. State of energy (SoE) is the ratio of energy remaining to energy capacity, measured in watt-hours. The link between them is voltage. Energy is the integral of voltage over charge, so a coulomb is worth more energy when the cell is full and its voltage is high than when it is nearly empty and its voltage has sagged.
This distinction is well established in the literature. There is a substantial body of work on estimating SoE for range prediction, using Kalman-filter variants and neural networks, and a direct experimental comparison of the two metrics has shown the SoC-to-SoE difference grows with C-rate, with lower temperature, and with age. That work frames SoE as a quantity a battery management system should estimate. The framing here is different: we want to show, mechanistically, why the charge number on a display misrepresents time to empty for a power load, and what sets the size of the error.
Two effects, not one
Effect one is energy weighting, and it exists at zero current. Because the open-circuit voltage falls as the cell empties, the charge sitting at the bottom of the tank is worth less energy than the charge drawn from the top. Take the equilibrium voltage curve, integrate it, and the remaining energy fraction always sits below the remaining charge fraction. This is a property of the chemistry, not the load. It holds when the current is a microamp.
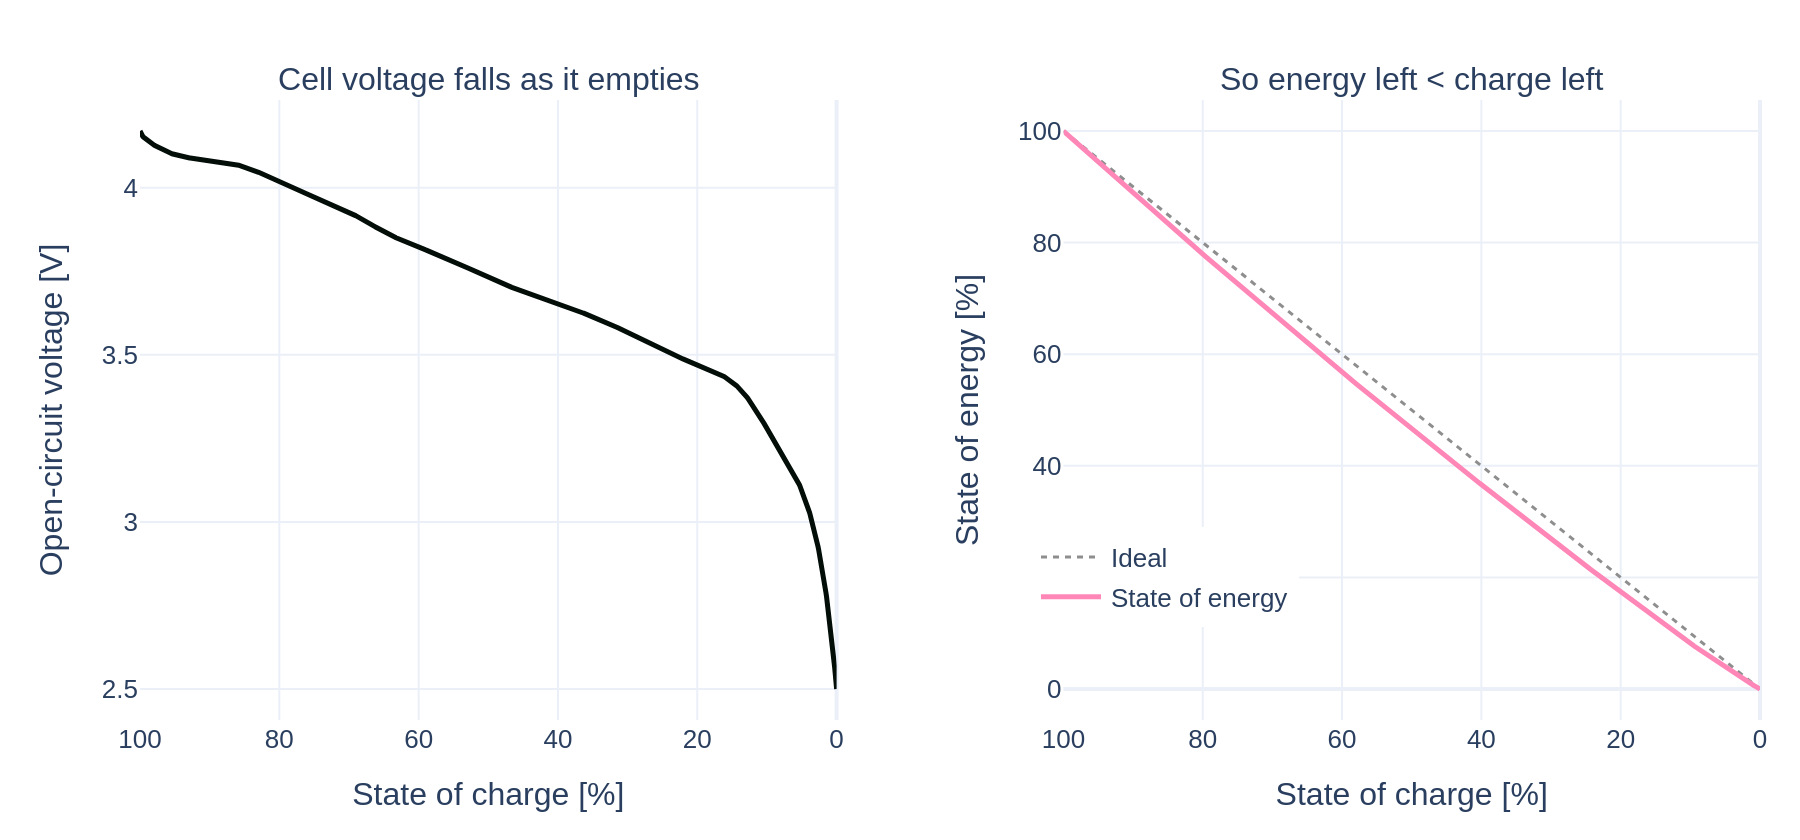
The bow in the right panel is Effect one on its own. At 50% state of charge, the equilibrium state of energy is about 46%. Modest, but it never goes away, and it is entirely invisible to a coulomb counter.
Effect two is the power-voltage-current relationship under load, and it grows with rate. A load that draws constant power draws current inversely proportional to terminal voltage: I = P / V. As the cell discharges and its voltage sags, the current must rise to hold power constant. Higher current means a larger overpotential, which drops the terminal voltage further, which raises the current again. The feedback accelerates toward the end of discharge and trips the lower voltage cutoff earlier than a charge-based estimate would predict. Some charge is still in the cell when it cuts off, but it cannot be delivered at the required power.
Simulating it on a real cell
We simulate a virtual LG M50 (NMC811/graphite, 5 Ah nominal) using the Chen 2020 parameter set, the widely used parameterization of this cell. The model is PyBaMM's DFN with a lumped thermal model, so self-heating raises the cell temperature during fast discharge and recovers capacity the way a real cell does. Reference capacity and energy come from a slow C/20 discharge: 5.09 Ah and 18.9 Wh, a mean voltage of 3.70 V.
For each discharge we hold power constant and run to the 2.5 V cutoff, tracking charge passed (which sets SoC) and energy delivered (which sets SoE). Because power is constant, the fraction of runtime remaining at any instant equals the state of energy exactly. That makes the comparison direct: plot the true runtime fraction against the charge reading a coulomb counter would show.
The mechanism is visible in a single discharge. Under constant current the current is flat by definition. Under constant power at the same nominal rate, it climbs.
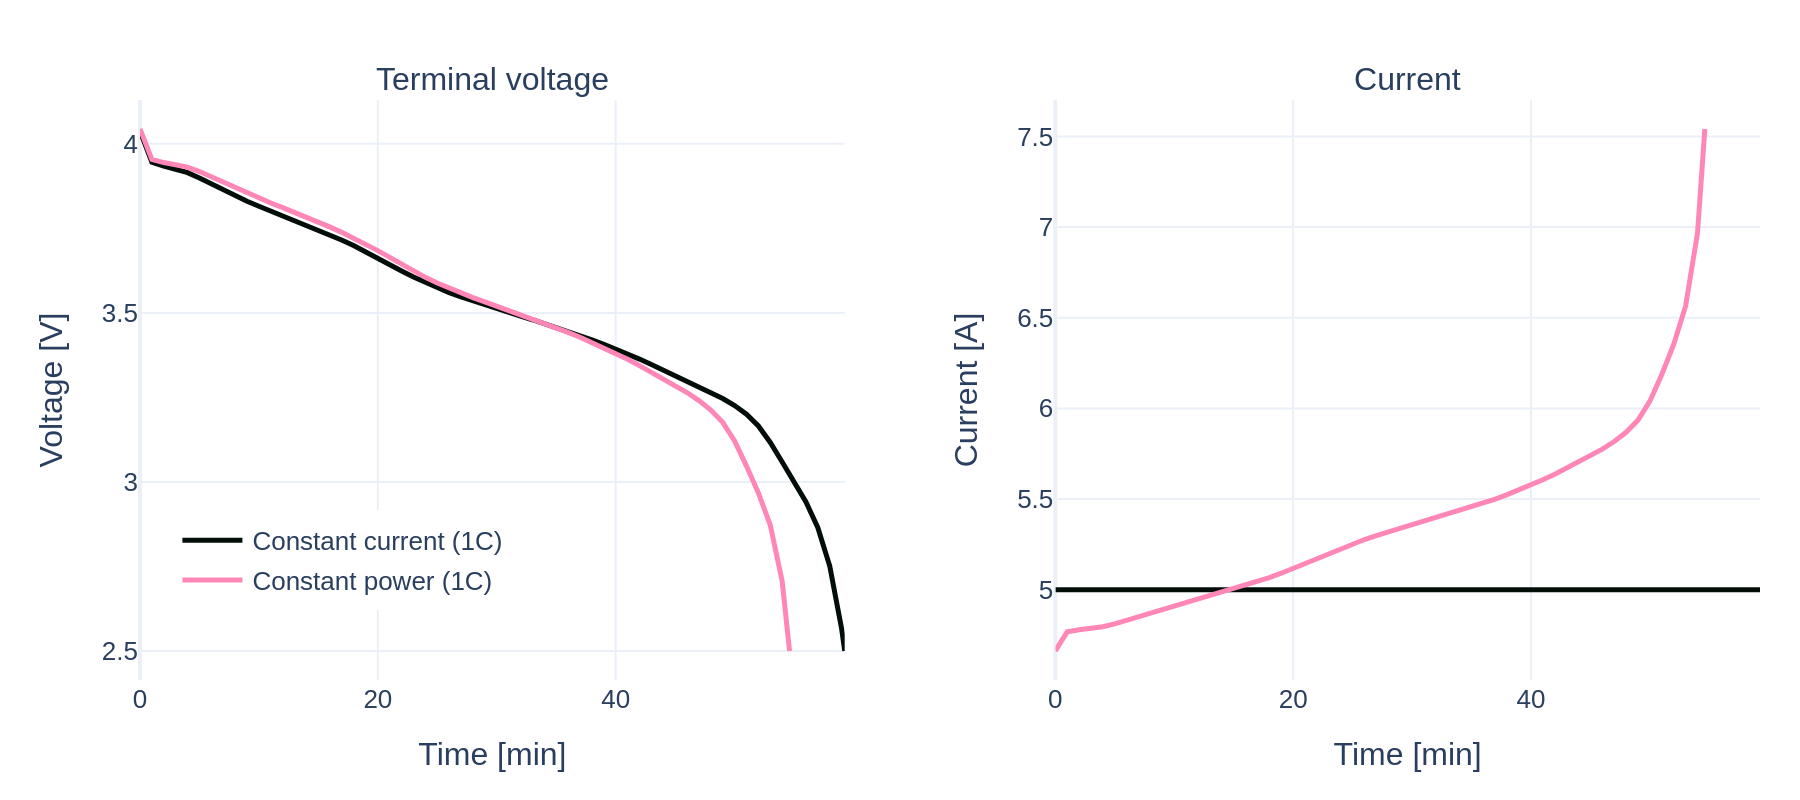
State of charge overstates the time you have left
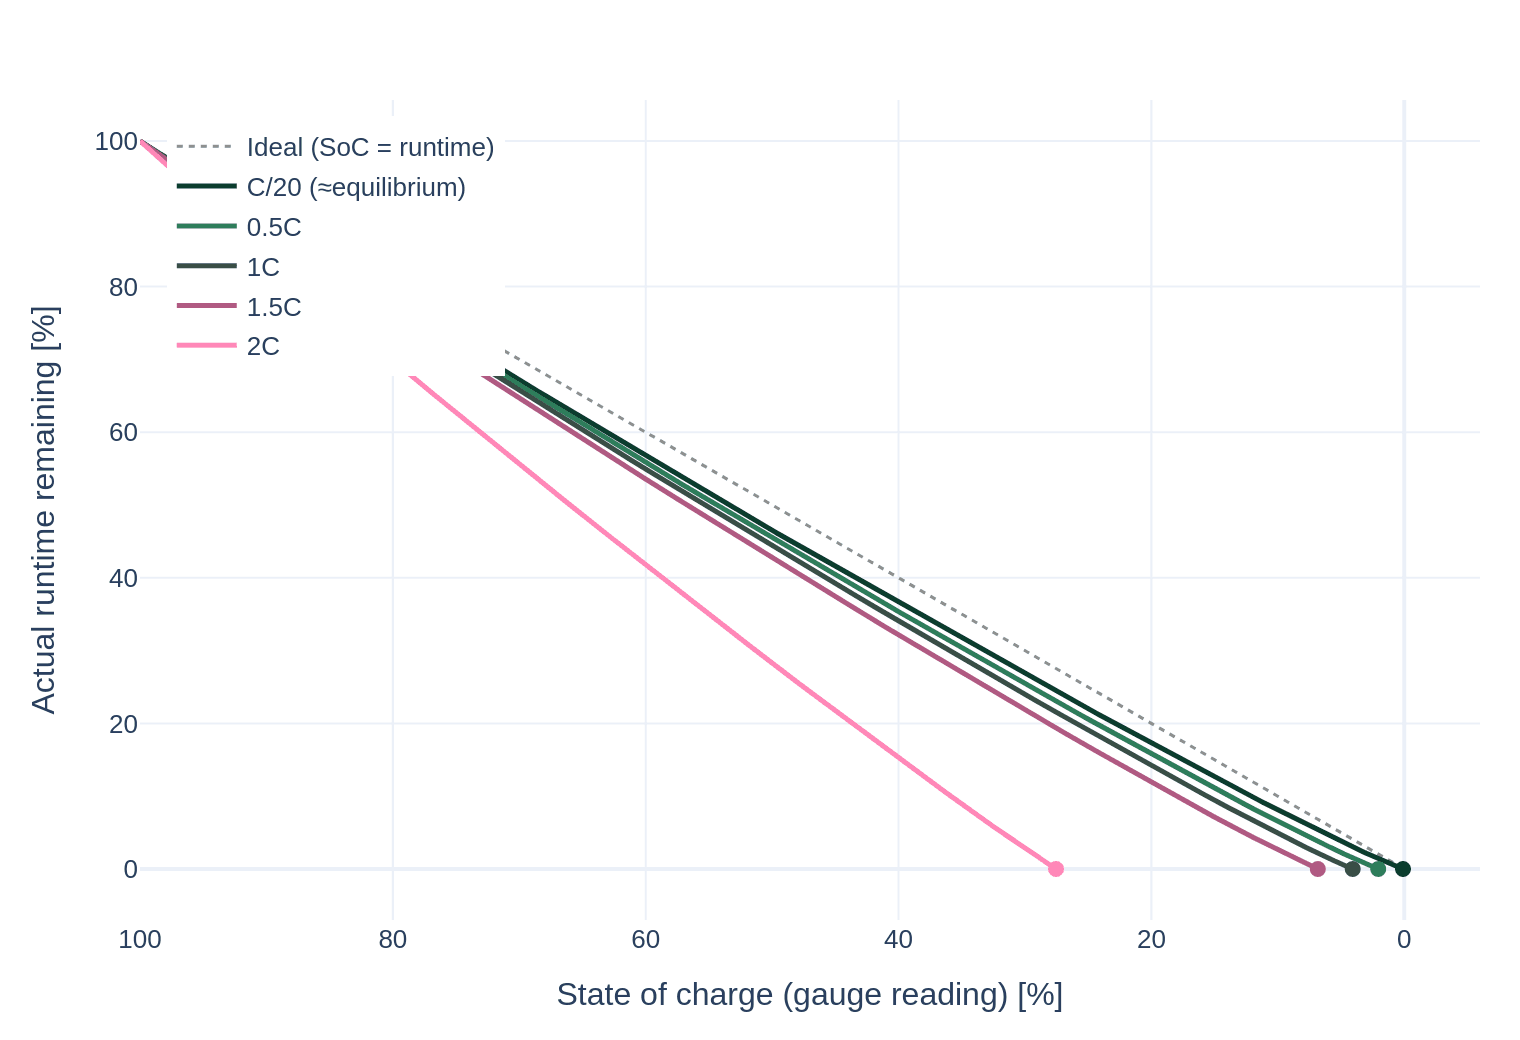
Plotting the true runtime remaining against the state-of-charge reading, for a range of discharge powers, shows the whole story on one axis.
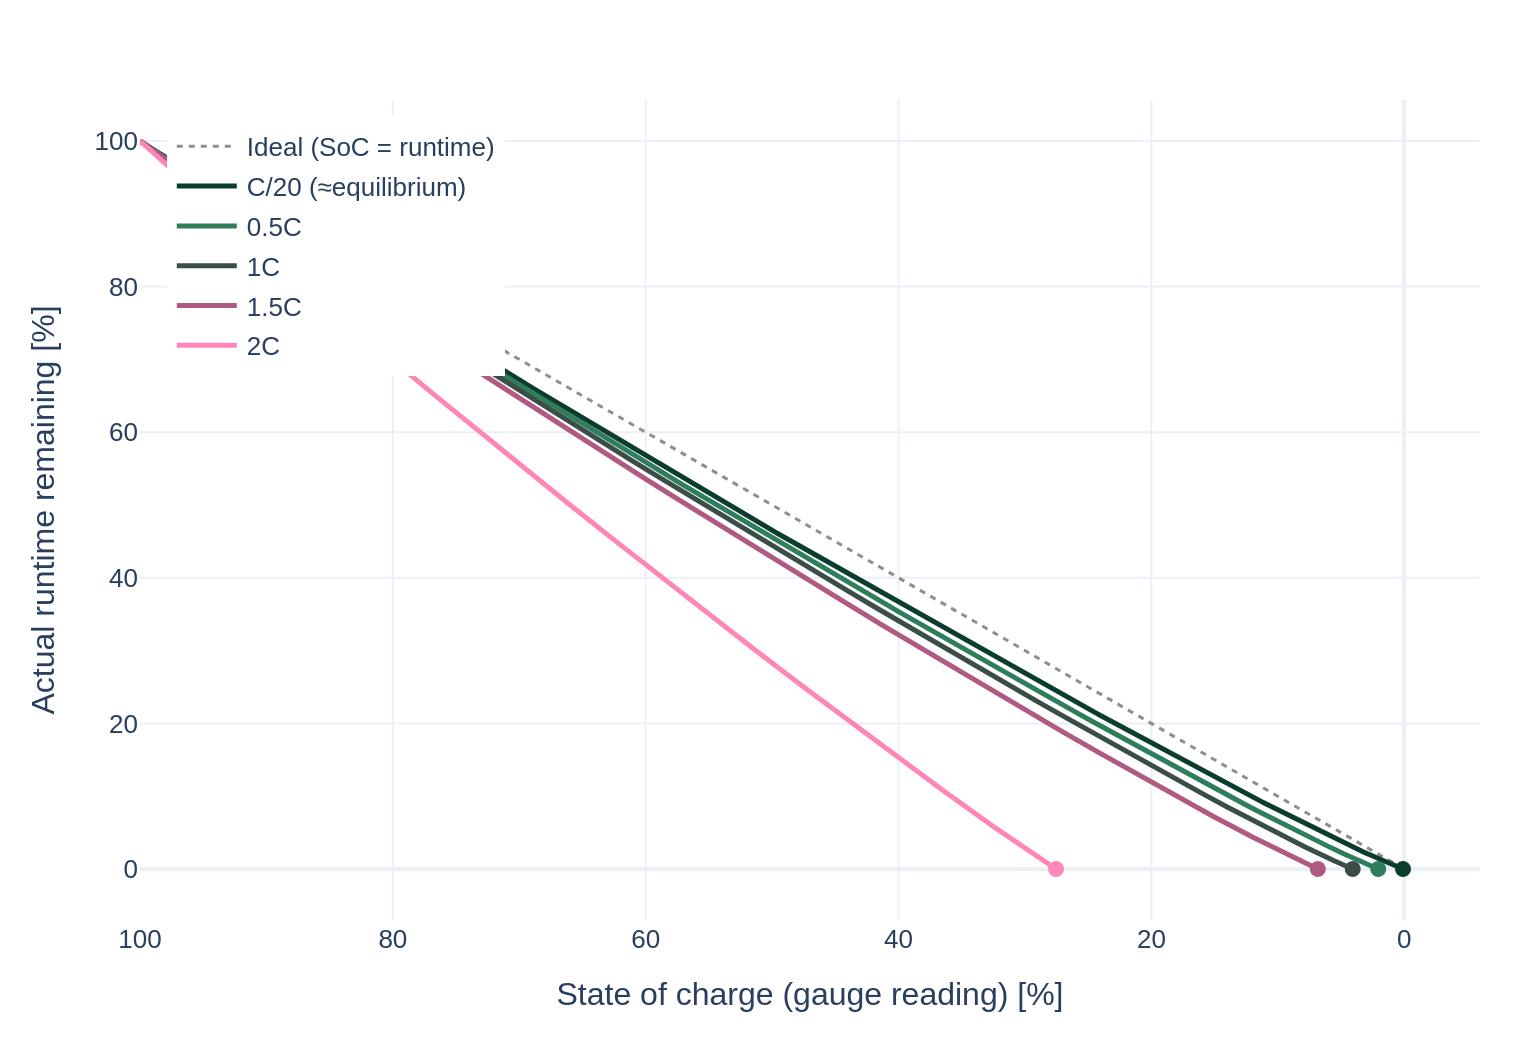
Two features matter. Every curve sits below the diagonal, so the charge reading is always optimistic about runtime. And the curves fan out with power. At C/20, a 50% reading corresponds to 46% of runtime left. At 1C it is 45%. At 1.5C it is 42%. At 2C the discharge terminates while the gauge still reads 28%, so the cell dies showing more than a quarter charge remaining. The endpoints of the high-rate curves are the charge that was present but undeliverable at that power.
Why the last stretch drains fastest
The everyday version of this is the phone that seems to shed its final quarter faster than its first. Break a moderate constant-power discharge into ten equal state-of-charge bands and measure how long the cell spends in each.
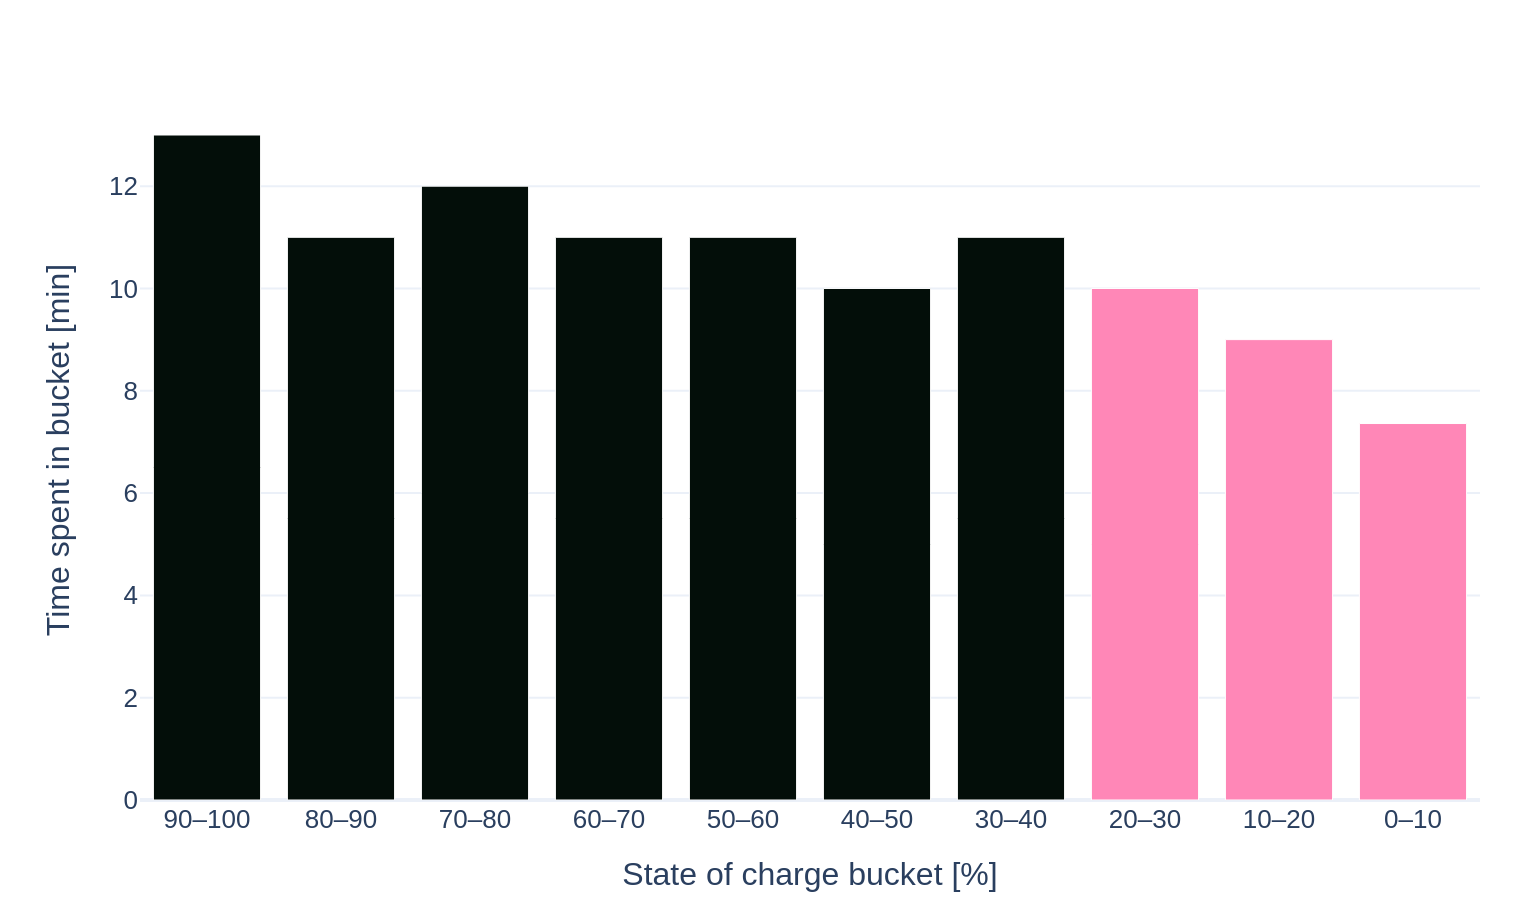
Each ten-point drop near the top of the range takes about 13 minutes. Near the bottom it is closer to nine. The percentage falls at a constant pace only if the load is constant current. Under constant power it accelerates, because each point of charge near empty is spent at higher current. This is mostly Effect one at phone-like rates, with Effect two adding to it whenever a demanding task briefly raises the power draw.
To answer the question directly: consumer devices display state of charge, not state of energy. The percentage comes from a fuel-gauge IC doing coulomb counting anchored to voltage. That is a charge number. Some devices compute a separate time-remaining estimate that is closer to an energy calculation, which is why that estimate jumps around as the load changes while the percentage ticks down smoothly. The smooth number is the one that misleads.
The gap has a floor and a slope
Because the two effects have different origins, they add rather than trade off. Effect one sets a floor that is present at any rate. Effect two adds to it as power rises.
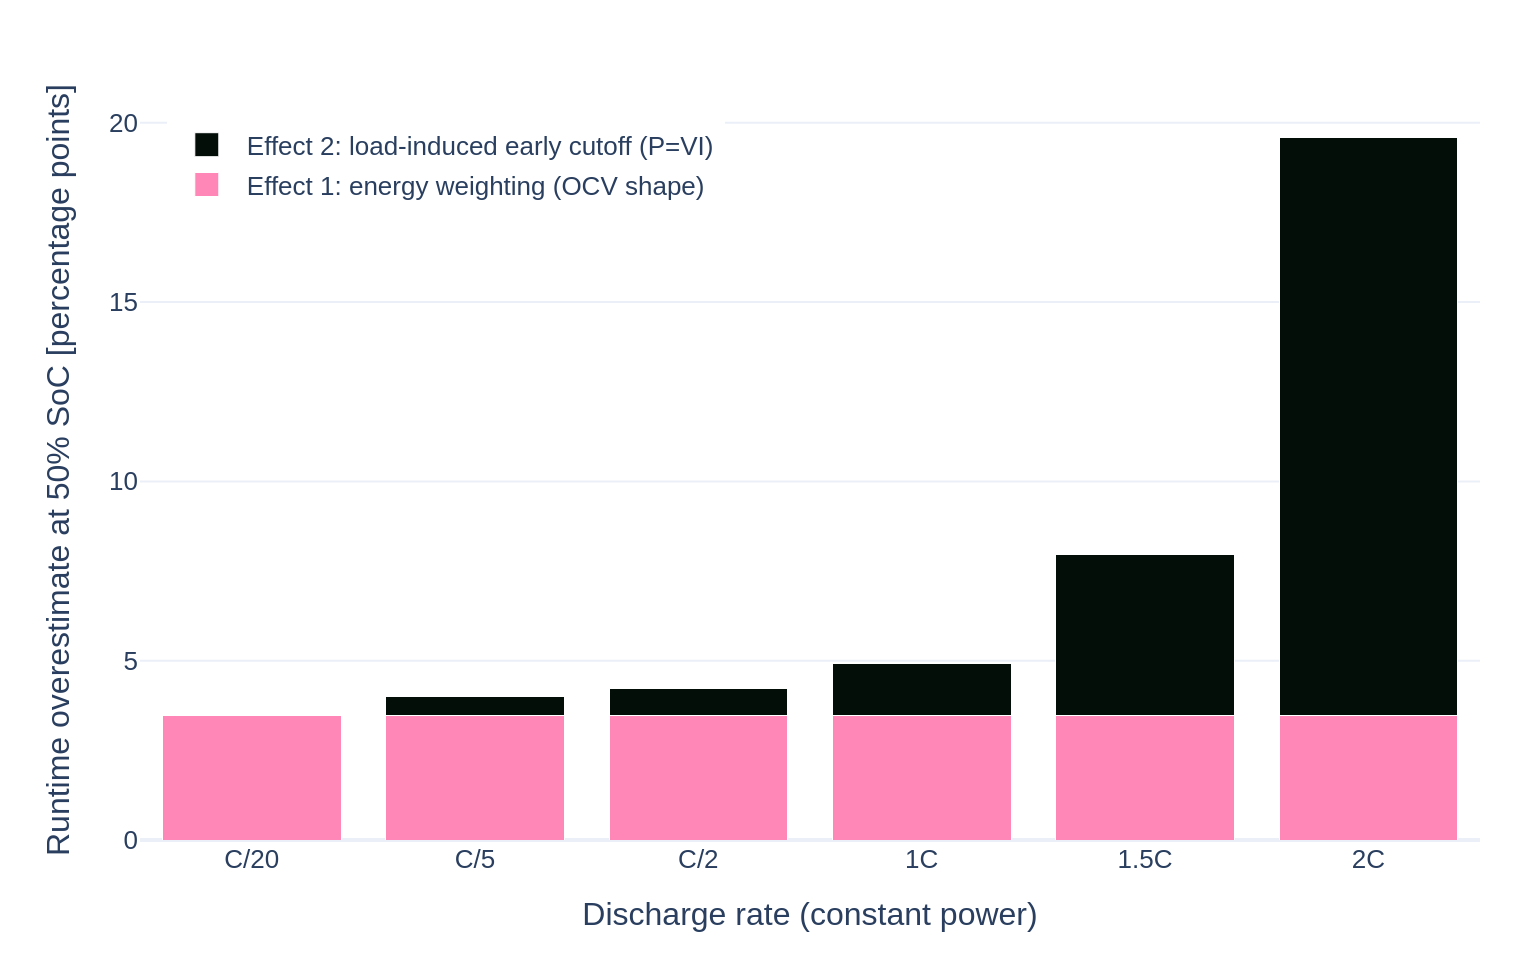
At C/20 the overestimate is the floor alone, about three and a half percentage points. It grows slowly at first, reaching five points at 1C and eight at 1.5C. Above that the load term runs away as the cell approaches its power limit: at 2C the overestimate is roughly twenty points, and the discharge ends with the gauge still reading 28%. The floor is what most treatments of "SoC is misleading" miss: even a perfectly rested, slowly discharged cell delivers less runtime than its charge reading implies. The slope is what makes the problem acute for power applications.
Temperature moves both terms. Self-heating during the fast discharges above helps, raising the cell to between 43 and 74 degrees at 1C to 2C and recovering capacity. A cold start does the opposite, steepening the voltage sag and widening the gap, consistent with the measured temperature dependence of the SoC-to-SoE difference.
What this means for real applications
Most systems that matter draw power, not current. A power tool holds torque. A drone holds thrust. An EV climbing a grade holds road power. A data-center UPS holds a fixed electrical load through an outage. In each case the quantity the operator needs is time to empty at the current power, and that is state of energy. A charge-based estimate will read high, and it will read highest exactly when the load is heaviest and the margin matters most.
| Application | Load character | Metric that predicts runtime |
|---|---|---|
| Consumer electronics at idle | Low, near constant | SoC and SoE nearly agree |
| Phone or laptop under demanding tasks | Moderate, variable power | SoE; SoC reads a few points high |
| Power tools, drones, robotics | High constant power | SoE; SoC reads high and dies early |
| EV range at highway load | High sustained power | SoE, temperature-compensated |
| Backup power and UPS sizing | Fixed power for a set duration | SoE; sizing on SoC underdelivers |
| Coulomb-counter calibration, capacity checks | Defined by charge | SoC is the correct metric |
State of charge is the right metric for what it measures: how full the tank is in coulombs. It is the wrong metric for how long the tank will last under a power load. For that, energy is the currency, and the conversion between them is the voltage curve plus the load.
Ionworks Studio simulates constant-power, constant-current, and duty-cycle discharges on a parameterized cell model, tracks charge and energy together, and compares against measured data from any cycler brand. Book a demo to see how teams build runtime and range predictions on the metric that actually governs them.
Frequently asked questions
Continue reading